AUC-ROC CURVES
& LASSO REGRESSION
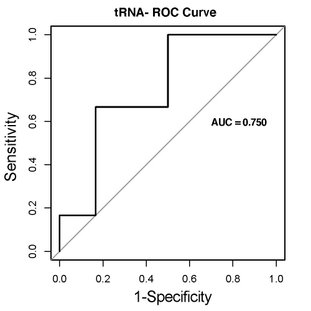
NGS data analysis provides information on many genes and RNAs that are differentially expressed when comparing functional sample groups. How well a transcript would perform as a biomarker in discriminating, for example, cancer from healthy samples, can be calculated based on on their true positive rate (TPR) and their false positive rate (FPR).
A ROC (receiver operating characteristic) curve is a visualisation of TPR vs FPR. The further the plotted line separates above the diagonal line, the better a given biomarker is because this indicates a large TPR and a small FPR. As a summary of the ROC curve, the AUC (area under the curve) is a numerical value describing the ability of a biomarker for distinguishing groups. We provide these for the most promising biomarkers when it is relevant for the experimental setup.
In addition we can provide additional analysis to extract subsets of markers with increased discrimatory power to be tested/validated in the lab. To find such a subset we use the LASSO method (Least Absolute Shrinkage and Selection Operator). LASSO selects a subset of markers and improves the prediction accuracy and interpretability of the statistical model by performing both variable selection and regularization.
The outcome is an improved proved ability to distinguishing groups by using a combination multiple biomarkers.
The ration of true postives to false postives will be displayed as a curve relative to a 1:1 line. The biomarkers that are included in an optimal biomarker model are identified.

In addition to the visualizations, you will recieve a table with all of the ROC curves and calculated AUC metrics for each gene of interest.

NGS service provider with a focus on customer needs. We deliver flexible solutions to your specific demands.
Contact us for a non-binding discussion about your next project.


